AI Transformation Platform

Map your organization.
Simulate the future.
Execute with confidence.

The Organizational Digital Twin gives you the structural clarity to deploy AI at scale - before committing to a single change.

Organizational Digital Twin  -  Design Structure Matrix visualization
🏆

ODC-Accenture Prize - Best Practice-oriented Paper, Journal of Organization Design. The methodology behind the Organizational Digital Twin is field-tested and academically recognized.

Read the paper →
Trusted by
The Platform

The Organizational Digital Twin

Maps your organization the way engineers map complex systems - making structure visible, measurable, and redesignable. AI can't scale inside what it can't see.

Organizational Digital Twin layered model

Five layers. One living model. The full system, not a slide deck.

The core concept
Organizational Digital Twin
Every dimension of the organization - structure, people, work, and AI readiness - modeled in one living system
account_treeStructure
4 layers · 9 units
CEO
COO
CCO
CFO
CHRO
CTO
Production
2 800
Sales
1 610
Engineering
1 990
Finance
265
HR
370
IT
380
monitoringHealth
34
Alignment
28
Gap Score
12
AI Ready
groupsPeople
9 565 FTE
Operations
2 410
Commercial
1 080
Technology
1 240
Enabling
380
routeWork
142 activities
Ops
Sales
Eng
Fin
HR
Planning
E
S
E
A
Delivery
E
S
E
Reporting
S
S
E
S
Support
A
S
E
E
neurologyAI Potential
2 140 h/mo
Operations
18%
Finance
14%
Engineering
10%
Sales
8%
Initializing scan...
How the Platform Works

From AI Pilot to Business Impact - in Months, Not Years

One platform. Three phases. We do the modeling. Your organization owns the outcome.

Define
your target operating model

We start with where you want to go. Based on your mission and strategy, the Organizational Digital Twin designs your target operating model - where AI works, where humans lead, and how both connect across your value streams. The result is a precise, AI-ready blueprint for your organization.

Target Operating Model

Future state defined before current-state analysis begins

Human–AI Work Division

Explicit framework for what AI handles and what humans own

Design Criteria

Agreed principles for evaluating every structural option

Strategy Diamond Overview  -  Arenas, Vehicles, Differentiators, Staging, Economic Logic
Strategy Diamond - five questions every leadership team needs to answer before redesigning structure.
Define
hub Value Network - hospital case
grid_view Map the operating model medical_services Inspect a function edit_document Trace inputs & outputs
Hospital value network  -  full operating model
Manage Outpatient Referrals  -  inputs and outputs
Clinical Documentation & Care Planning  -  inputs and outputs
20 functions, 38 connections - the full hospital operating model in one view
20
Functions mapped
38
Connections traced
100%
Inputs & outputs defined
Discover
your current state

With the target operating model defined, we map your current state in detail - who works with whom, on what, and how decisions flow through the organization. The Organizational Digital Twin ingests your structural data and reveals the friction and inefficiencies that are invisible to the naked eye. This is the foundation on which the Develop module builds.

Detect Bottlenecks

Maps dependencies - surfaces hidden coordination overload and friction points

Design Structure Matrix

Maps every dependency between roles and functions - making invisible coordination load visible

AI Potential Scan

Scores every function: FTE, AI hours per month, coordination load

Discover
radar Mapping current organization
supervisor_account
Executive Team
4 direct reports · 154 total FTE
manufacturing
Operations
48 FTE · 12 functions
inventory_2
Product
32 FTE · 8 functions
terminal
Technology
56 FTE · 14 functions
account_balance
Finance
18 FTE · 6 functions
High High
bolt Hidden dependency detected
42 Functions
154 FTE
3 Bottlenecks
23 Collaboration flows
Design Structure Matrix · Real client engagement
Design Structure Matrix showing dependencies between people across Accounting, IT, Marketing, and Sales  -  clustered by department, with cross-functional ties highlighted on the right as a network graph

Each cell is a coordination touchpoint between two people. Diagonal blocks show within-department coordination; off-diagonal cells expose cross-functional load. The network view on the right summarizes the same data as a high-level map.

Develop
your transformation roadmap

With target and current state both modeled, the Organizational Digital Twin calculates the delta - quantifying cost savings, capacity release, and AI opportunity by function. The output is a board-ready business case and a phased transformation roadmap, built on evidence rather than assumption.

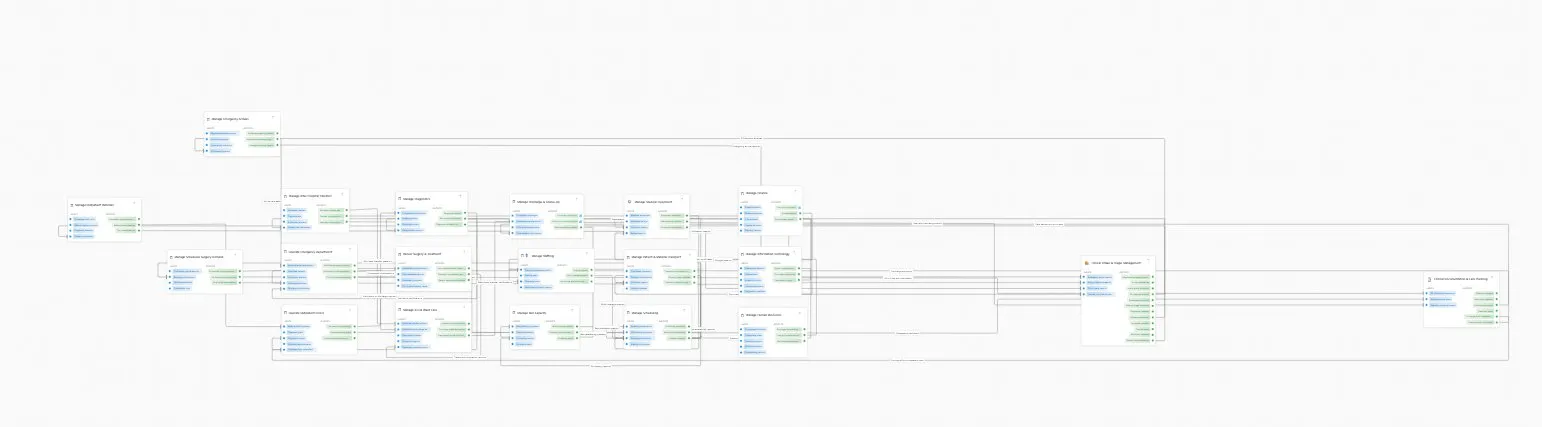
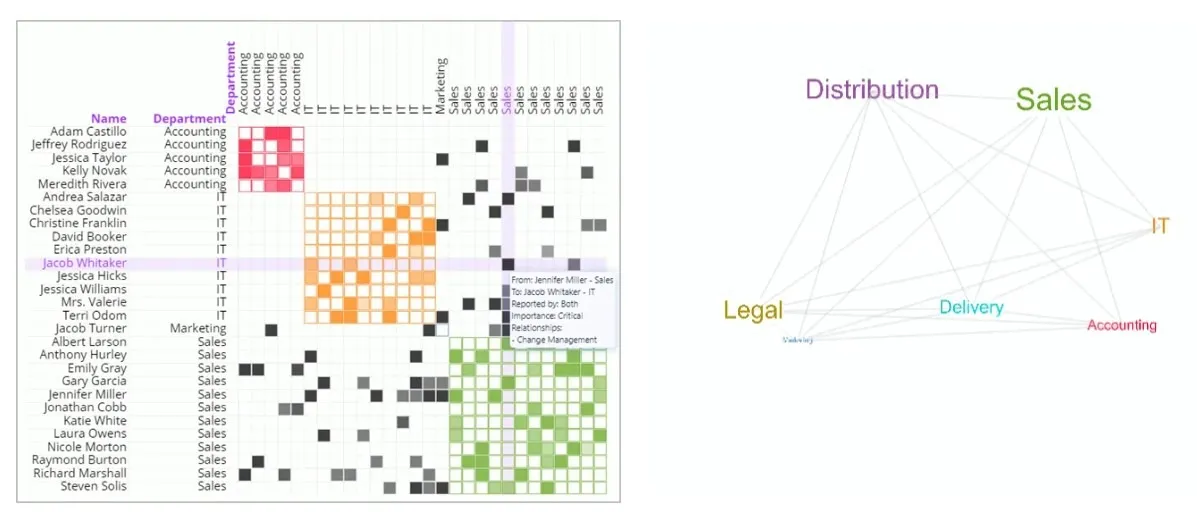
Structural Simulation

Thousands of configurations evaluated - optimal structure surfaced

Business Case & Roadmap

Delta analysis, cost model, phased milestones - board-ready

Implementation Cycles

Structured delivery with capability transfer built in

Transformation Gap Analysis
Target Operating Model vs Current Organization · 9 565 FTE
Analyzing
!
17 unresolved gaps are costing €47M annually. Closing them requires €12M.
Commercial and Enabling functions are significantly understaffed relative to the target model. 18 initiatives across 4 waves will close the remaining gaps. The transformation investment pays back within 14 months - a 3.9x annual return.
Gap Resolution
In progress
0
of 24
7 gaps resolved. 17 remain across capacity, capability, and structure.
Transformation Investment
Budget required
€0M
to close remaining 17 gaps
18 initiatives across 4 waves. Payback within 14 months at current run-rate.
Annual Cost of Inaction
Action required
€0M
per year in unrealized value
Structural waste, capability gaps, and coordination overhead erode €47M annually if left unaddressed.
24 Gaps by Category
Capacity0
Capability0
Structure0
Leadership0
Coordination0
Headcount: Current vs Target
Operations
0
Commercial
0
Technology
0
Enabling
0
Gap Priority Matrix
24 structural gaps plotted by strategic impact vs implementation effort
Must-win
Differentiating
Enabling
Hygiene
Transformation Roadmap
12 initiatives across 3 waves - phased for maximum value capture
Cumulative value
€0M
Total investment
€0M

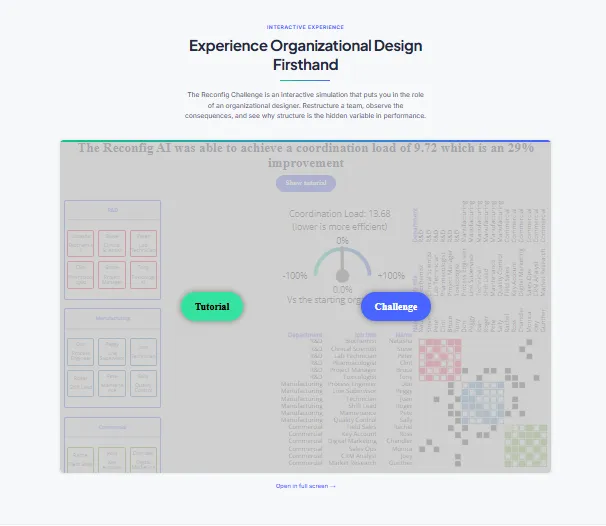
The transformation gap, quantified - every gap plotted by impact vs effort - and the phased roadmap that closes them, with costs and value modeled wave by wave.

Human–AI Collaboration

AI + Humans = Intelligence, Scaled. Outcomes, Accelerated.

Every organization faces the same challenge: where to apply AI, where to rely on people, and how to integrate both. Reconfig defines that blueprint - prioritized by value, tested through simulation - before execution begins.

AI Potential

Quantify AI Potential Across Every Function

Before any deployment decision, Reconfig scores each team: Total FTE, AI potential in hours per month, span of control, and coordination load. Know exactly where AI delivers value.

📊

AI potential scored

Total FTE, AI h/month, coordination load - quantified before deployment

📐

Prioritized by value, not opinion

Functions ranked by impact, effort, and risk - so investment goes where it returns the most

Define
hub Value network generation
Demand78% AI Sourcing62% AI Design45% AI Planning55% AI Production72% AI Quality25% AI Logistics68% AI Compliance18% AI Distribution70% AI Service40% AI Returns Processing
5 Value streams
18 AI-ready functions
12 Human-led
68% augmentable
Work Division

Define Where AI Works and Where Humans Lead

The platform identifies which tasks AI handles and which require human judgment - with expected impact and risk labelled for each function. Every recommendation is explainable and testable.

🤝

Explicit work split

AI tasks vs human tasks with expected impact and risk per function

⚖️

Accountability preserved

Every AI output has a clear human owner - no governance gaps

Define
handshake Human-AI work division
strategy
Strategic Workforce Planning
Strategic function · 8 activities · 12 FTE
78% AI
person Human judgment
gavelValidate workforce scenarios
groupsAlign leadership on priorities
visibilityOversee change execution
edit_noteApprove final recommendations
swap_horiz
AI drafts, human validates
sync
AI models, human decides
fact_check
AI tracks, human steers
smart_toy AI-augmented
query_statsWorkforce gap analysis
model_trainingCapacity simulation
monitoringPerformance tracking
auto_awesomeDraft implementation plan
shield_person
Accountable owner
Chief People Officer
check_circleHuman accountability
Value

Quantify the Transformation Value - Before You Commit

Reconfig translates structural change into a board-ready business case: cost of inaction, sources of value, and total annual benefit - every euro tied to a specific lever in the redesign.

💼

Board-ready business case

Cost of inaction, sources of value, and ROI - modeled per function

🎯

Every euro traceable

Each value driver maps to a funded initiative in the transformation roadmap

Transformation Value Waterfall
From cost of inaction to captured value - where the €47M comes from
trending_up
Invest €12M to unlock €47M in annual value. Payback in 14 months.
Leadership reduction and span optimization deliver immediate structural savings. Revenue enablement and automation drive the largest long-term value.
Experience It

Can you design a better organization?

Map how roles collaborate in a real organization
Reduce coordination load by redesigning team structure
See how your solution compares to the Reconfig algorithm
No login required - takes about 5 minutes
Reconfig Challenge Game
INTERACTIVE EXPERIENCE
For leadership teams

You've seen the platform. Now see what it shows about your organization.

A 60-minute executive session. We'll bring a simulation of your organization built before the meeting - no internal data required, no commitment.