AI-Powered Risk Management

Most projects fail for reasons
no Gantt chart can see

Rework, miscommunication, overloaded decision-makers. The real causes of delay and cost overrun are organizational - and invisible to conventional planning tools. Reconfig makes them visible before they happen.

7.5%
CapEx reduction on $20bn LNG programme
12 mo
Saved on NASA Ares rocket carrier programme
4 wks → 2 d
Steel mill maintenance downtime reduced
>90%
Accuracy predicting $1bn FPSO delay 4 yrs out
The Problem

Every project carries a hidden cost: organizational drag

When projects are planned, they assume work flows cleanly from start to finish. In reality, people make mistakes, need to coordinate, and create rework. These costs - invisible on a Gantt chart - are what separate the plan from what actually gets delivered.

Reconfig makes them visible. Before the project starts.

Rework, coordination, and decision wait
As planned
Work
As executed
Work
Rework
Coord.
Wait
↑ 38% schedule overrun
Work (value creation)
Rework
Coordination
Decision wait
Conventional vs Reconfig

Most planning tools assume people perform as planned

Gantt charts and PERT diagrams treat schedule risk as time uncertainty in individual tasks. Reconfig models the human and organizational dynamics that actually drive overrun - the rework loops, coordination failures, and decision bottlenecks conventional tools assume away.

Conventional Risk Analysis · PERT / CPM / Gantt

Task scheduling and timeline uncertainty

  • Treats risk as time uncertainty in individual tasks
  • Assumes people complete work without error, on schedule
  • Produces Gantt charts and critical-path diagrams
  • Misses rework loops, coordination costs, and decision bottlenecks
  • Best suited to technically stable, well-scoped projects in stable environments
Reconfig · Agent-Based Organizational Modeling

Organizational dynamics and project performance

  • Models human behavior - errors, rework, communication delays, overload
  • Simulates coordination failure and decision bottlenecks before they occur
  • Quantifies the cost of organizational drag on schedule and budget
  • Identifies where AI agents can reduce rework and improve coordination
  • Built for large-scale, high-stakes programmes with complex interdependencies
How It Works

Four models. Each adds a layer of organizational reality

We build a series of increasingly realistic simulations of your project organization. The gap between them becomes your business case.

Model 1 · Baseline

Idealised project

All activities run with perfect execution - no rework, no coordination delays. The theoretical best case. Establishes the lower bound on duration and cost.

Model 2 · Reality

Realistic project

Human agents make mistakes, coordinate imperfectly, and create rework. This is what your project actually looks like - delays, overruns, and quality risk included.

Model 3 · AI-augmented

AI-augmented project

AI agents absorb automation potential identified by Reconfig. Rework decreases. Coordination improves. The gap between plan and execution closes significantly.

Output · Business Case

Quantified delta

The difference between Model 2 and Model 3 is your business case: cost savings, schedule reduction, and quality improvement - calculated from your project data.

Adding each layer of reality reveals what conventional tools hide

Layered organizational simulation: external entities, stakeholders, project manager, sub-managers, activities, and a sequence of yellow tasks connected by blue precedence links and red/green rework loops  -  modeled simultaneously for a hypothetical Green Fuels Innovation Programme in Rotterdam.

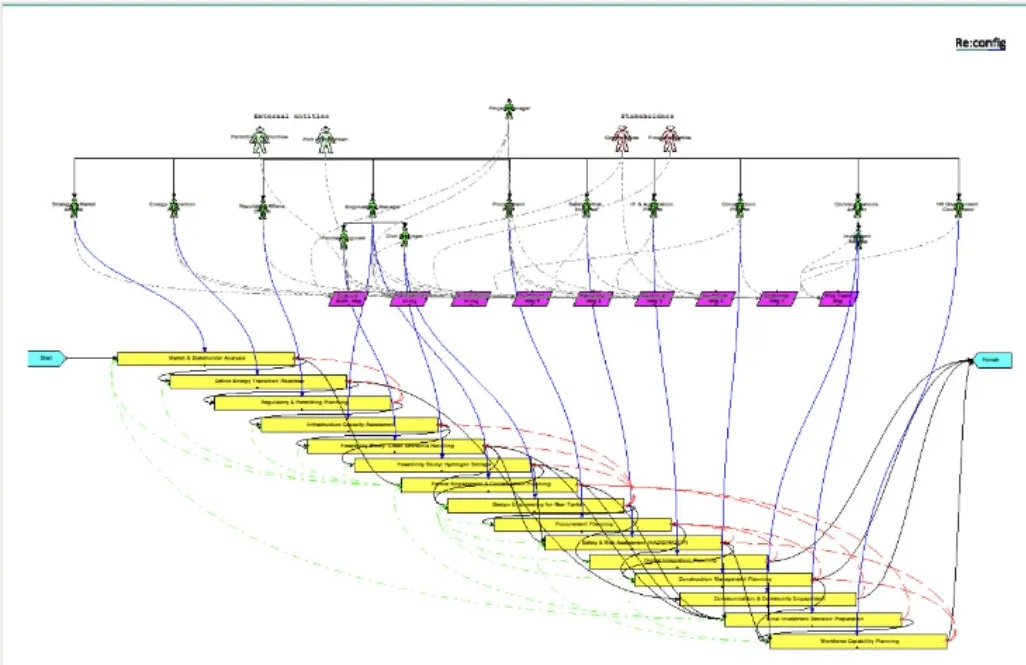
Green Fuels Innovation Programme, Rotterdam (hypothetical case). Tasks (yellow), precedence links (black), communication links (blue), and rework loops (red/green) are modeled simultaneously. The complexity visible here is what conventional planning tools assume away - and where most project overruns originate.

Real-World Results

Validated across capital programmes worldwide

Industry results from project organization simulation - modeling the same approach we apply, validated across mining, heavy industry, space and shipbuilding programmes.

Steel mill facility
Heavy Industry · Steel
4 wks 2 days

Maintenance downtime for a steel mill facility reduced from over four weeks to less than two days - through simulation-driven redesign of the maintenance organization.

Industrial facility · Maintenance organization redesign
Onshore LNG drilling rig
Energy · LNG
7.5% CapEx

CapEx reduction achieved on a $20 billion onshore LNG project encompassing 530 kilometres of pipelines and large-scale automation - by optimizing the project organization before construction began.

$20bn onshore LNG programme
Rocket launch
Space & Defence
12 months saved

Construction time for the NASA Ares rocket carrier reduced by 12 months through project organization simulation and redesign prior to programme launch.

NASA Ares rocket carrier programme
FPSO vessel under construction
Shipbuilding · FPSO
>90% accuracy

A six-month delay in a $1 billion Floating Production Storage Offshore vessel conversion was predicted four years in advance - with accuracy exceeding 90% - allowing the client to restructure the programme before the delay materialised.

$1bn FPSO vessel conversion
What We Deliver

From simulation to delivery confidence

Every engagement is scoped to the specific programme - its scale, complexity, phase, and risk profile. We work with project directors from early design through execution.

Our professional services team works alongside your programme leadership to build the models, interpret the results, and translate findings into structural decisions your organization can act on.

All engagements are scoped to your programme. Pricing reflects scale, complexity, and phase of involvement.

Project organization design

Target operating model for the project - roles, responsibilities, governance, and AI/human work division - simulated before the programme begins.

Risk simulation and stress testing

Realistic modeling of coordination failure, rework loops, and communication risk - with quantified impact on schedule and cost.

AI opportunity quantification

Identification of automation potential by role and activity, with a simulated business case showing the schedule and cost impact of AI augmentation.

Programme-level reporting

Scenario comparison, milestone tracking, and executive dashboards - designed for project directors and programme boards.

Talk to a programme advisor

Make organizational risk visible - before construction begins

Tell us about your programme. We typically scope an initial conversation around scale, phase, and the specific risks you're tracking.

No commitment. We'll get back to you to schedule.